By Smári Ásmundsson · · 7 min read
The Monday revenue question, answered from two exports
"Where did the revenue go last week?" costs somebody the morning. One prompt turns two sales exports into one checked table, and the week our own dashboard got it wrong shows why the check is in there.
"Where did the revenue go last week?"
You ask it on a Monday, and in most seven-figure brands the answer costs somebody the morning.
Here is how that morning usually goes. Somebody logs into the distributor portal and downloads last week's file, which uses its own names for your products and takes deductions out before it shows you a total. Then the retailer portal, or Seller Central, or wherever your second channel reports. Then your own website orders. They paste all of it into one sheet, rename the distributor's "CHOC 24/CS" so it matches your SKU, decide whether to count revenue before or after the deductions, add it up by channel, and then do it all again for the week before so there is something to compare against. Three hours later you have an answer. Next Monday it starts from zero.
Most of that morning can be handed to Claude, an AI chat assistant like ChatGPT, today.
The first version, in one chat
Download two sales exports you already have, from two different channels, covering the same two weeks. Use whichever two matter most to you: a distributor file, a retailer portal export, your Amazon business report or your website orders. Open a new chat in Claude, attach both files and paste this underneath. (A prompt is just the instructions you type in. You can paste this one as it is.)
I attached two sales exports for my brand, from two different channels. They should cover the same two weeks.

1. For each file, tell me what it is, which dates it covers, and which columns hold revenue, orders and units. If a file is missing any days, say which ones before you do anything else.

2. If a file shows more than one revenue figure, for example before and after distributor deductions, tell me which one you used and keep the other beside it.

3. Match the products across the two files. The files will name the same product differently. Show me every match so I can check it, and list anything you could not match instead of guessing.

4. Build one table: revenue, orders and units for each channel, last week against the week before, with the change for each.

5. Check every total. Add up the rows in each original file yourself and show me that each channel total matches its file. If one does not match, tell me by how much and why.

6. Under the table, write three sentences on what changed and where I should look first.

Never fill in a missing number or a missing day. Show it as missing.
What comes back in a couple of minutes is the morning's work. One table, the product matches written out so you can check them at a glance, and the arithmetic proved against the files instead of asserted.
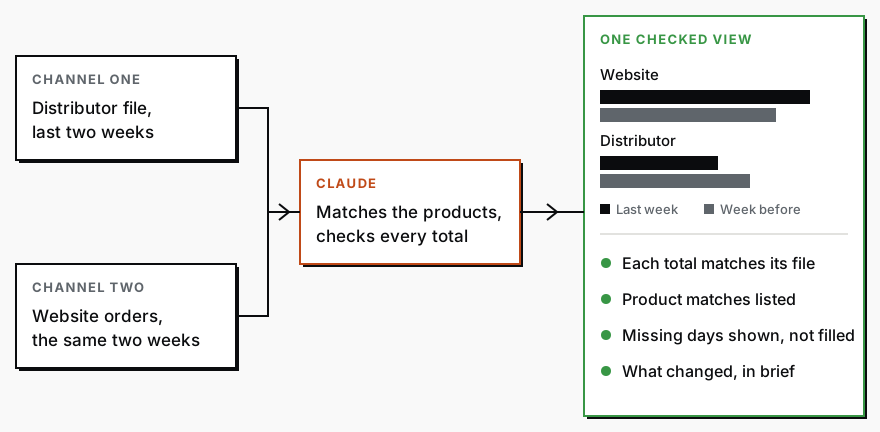
The product matching decides whether the table is worth reading. Your distributor and your website will never agree on what a product is called, and a table that matched them silently can be wrong in a way that looks right. The list of matches takes thirty seconds to read, and the products it could not match are usually the most useful thing on the page.
The number that looks fine and is wrong
The total check is in that prompt because of something that happened to me.
My own dashboard at NØRSE CØDE pulls our website, Amazon and wholesale orders into one weekly email. In August the Amazon feed stopped arriving, and nothing in the system noticed. The next weekly email told me the website was now all of our sales, and that revenue had fallen sharply against the four-week average. Both numbers were calculated correctly from the data the dashboard had. Neither was true.
A channel that goes missing does not show up as a gap. It shows up as a sales drop, and every other channel looks bigger by whatever the missing one used to be. You can lose a morning chasing a collapse that never happened. Worse, you can act on it. The same thing happens when a distributor file arrives a week late and the report gets built without it.
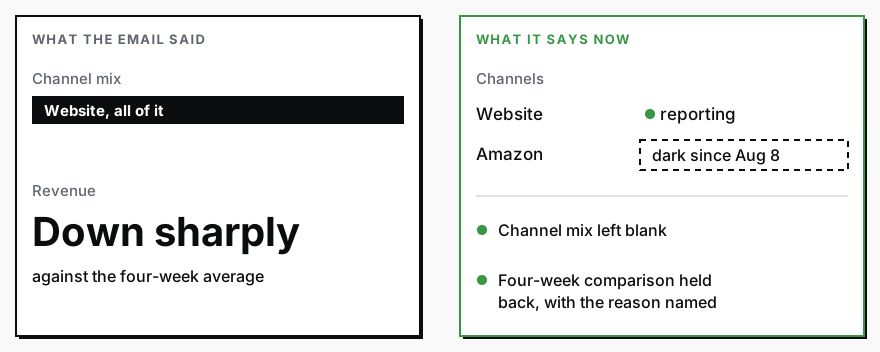
The report handles it now. When a channel that sells regularly goes quiet for two weeks, it keeps its row and is marked dark, with the date it stopped. The channel mix is left blank, because a share of only the channels still reporting would be the same lie again. The four-week comparison is held back too, since the earlier weeks had Amazon in them and this one does not.
Where this goes in the workshop
I teach this as week three of the AI CPG Workshop, which starts next Monday. On October 26 you build one dashboard on your own business: revenue, orders and units per channel, against the previous period, with every total checked against the file it came from. We start with two sources and two periods on purpose. An export counts as a source, which matters when half your numbers arrive as a file somebody emails you rather than a clean feed. Every number shows the dates of the file behind it, and a source that goes quiet is named at the top instead of disappearing into the totals.
Run that prompt for two Mondays and you will want it to run itself. That is week four, on November 2. You take a report you have checked and put it on a schedule, so it runs every Monday before anyone asks. You decide which step waits for your OK before it goes further. You also learn to recognise a run that went wrong, so you see it the morning it happens rather than three weeks later.
Weeks one and two build what the rest stands on. In week one you build the company knowledge bank: your products, customers, pricing and terms, kept in one place AI reads before it does anything else. That is where the distributor's product names get matched to yours once, so the matching step stops being a step. In week two you turn your reviews and support replies into sales copy, with the customer's own words next to every claim.
Week three has a limit worth knowing before you decide. We work from the files and exports you already have. Complex integrations, full ERP implementations and demand planning are outside the workshop's scope. If the question you need answered requires your ERP connected live, these four weeks will not get you there.
The details
Live teaching is on Mondays at 10 AM PT, October 12, 19, 26 and November 2, one hour each. Every session is recorded. Office hours are on Wednesdays at 10 AM PT, October 14, 21, 28 and November 4, for whatever broke between calls. Plan on about two hours a week applying the work to your own business.
You need a computer and a paid Claude plan. The Max plan at $100 a month is the one to get. You do not need to write code.
The price is on the page, with a lower rate for each extra person from the same company. If you are deciding who to send, send the person who builds the Monday numbers today. Registration closes when the first session starts.
See the four weeks and the price
Run the prompt either way. If the total check finds a channel that does not match its file, that is the real question for this week.
PS. If your brand sells direct and uses Klaviyo for its automatic emails, I am building one report live on Thursday, October 8, from 11 AM to noon PT, on a Startup CPG community webinar. It shows how each of those emails performs, and you can download the tool at the end and run it on your own account.
CPG AI Assessment
Fix the CPG workflow that keeps landing back on your desk.
I map the recurring reporting or operating workflow first, then build only when the first useful fix is clear.