By Smári Ásmundsson · · 5 min read
AI dashboard generator for a CPG founder: what it builds and how to check it
Can an AI dashboard generator build a CPG founder's weekly dashboard, and how do you check what it built?
The dashboard looks finished by nine in the morning. Revenue by channel, a trend line, a green arrow pointing up. Then someone in the weekly meeting asks where the distributor number came from, and nobody in the room can say.
An AI dashboard generator can build your weekly dashboard from two sales files in a few minutes. It will not tell you when a number on it is wrong. That takes a second pass, and the AI can run that pass too.
What an AI dashboard generator builds from two sales files
A dashboard generator is any AI tool you hand files and ask for charts. Give one the sales report you download from your distributor and your website orders for the same two weeks, and it returns revenue, orders and units by channel, this week against last, with a chart for each. The first version takes a couple of minutes. I use Claude, Anthropic's AI chat assistant, for this: you attach the files in a chat window and ask for the dashboard. The build itself is walked through in the weekly revenue question, answered from two files.
What the generator does not do is tell you whether the picture matches the business. That is the step this note covers.
How a generated dashboard gets a number wrong without showing it
A wrong number from a generator does not look wrong. It sits in the same font as every right one. Four ways it gets there:
- A channel goes missing. A file stops early, or one channel's sales never arrive, and the dashboard presents the channels that did arrive as the whole business. In August the Amazon sales stopped showing up in my own weekly report. The next email told me the website was now all of our sales and that revenue had fallen sharply against the four-week average. Every figure was calculated correctly from the data it had. Neither statement was true.
- Two meanings of revenue. One file reports before the distributor's deductions and another reports after. Both columns are called revenue, and the dashboard adds them together. Why two systems give two different totals is a note of its own.
- A product that does not match. Your distributor's "CHOC 24/CS" and your website's chocolate bar are one product with two names. If the generator cannot match them, it counts them as two products or drops one, and it does not warn you.
- Last week's picture passed off as this week's. A dashboard built from files you gave it does not update itself. Next week it shows the same numbers under a new date.
All four share a cause. The generator reports what it built, not what it left out. Only a comparison against the original files shows what is missing.
Three questions that decide whether to use it
Which numbers belong on a dashboard is covered in what should be on a founder's CPG dashboard. Whatever is on yours, a generated dashboard earns trust the way a new hire's report does, by showing its work. Ask three questions in order, and stop at the first no. One: does it say which file or system each number came from? Two: does it show how each number was worked out, row by row? Three: does a second pass match every total to the original file?
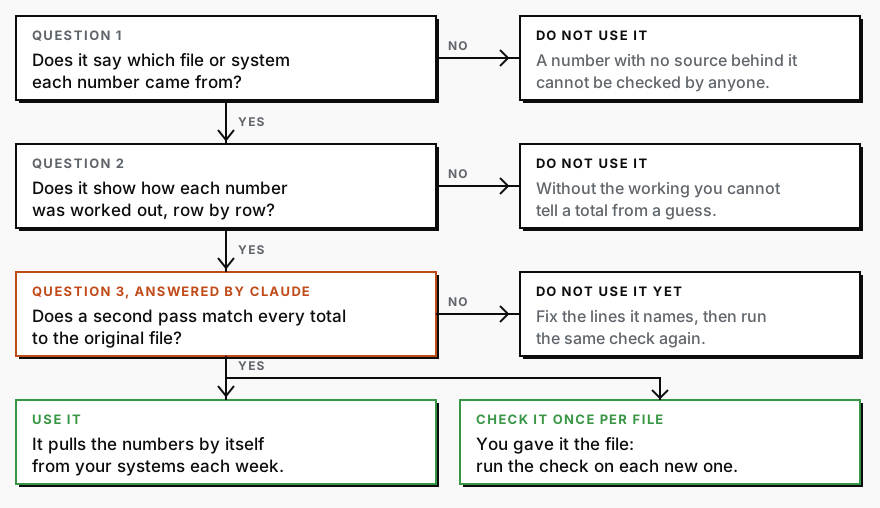
The first two cost nothing, because you read the answers off the dashboard itself. A number with no named file behind it cannot be checked by anyone, so it cannot be used. The third is the only one that takes effort, and the effort belongs to the AI.
Ask the tool where its numbers came from. If it names a file you gave it, run the check on every new file, because each new file is a new chance for a missing day or a renamed column. If it pulls the numbers by itself from your sales systems, one clean check is enough, but run it again whenever a channel looks strange, because the pulling can stop. Mine did in August.
The instructions that make AI check a dashboard against its source
Checking by hand means opening each original file, adding up the revenue column, comparing it to the dashboard's total for that channel, and tracing a few product lines back to the rows they came from. For two channels that is roughly two hours, and it is the first thing dropped on a busy week.
Today, give the AI the original files and the dashboard together and it does the same check in a couple of minutes, and whoever builds your weekly sheet can run it. This is what comes back first:
| Channel | Dashboard total | Total from the original file | Match |
|---|---|---|---|
| Website | $41,200 | $41,200 | Yes |
| Distributor | $18,650 | $19,980 | No, $1,330 short |
Under the table it explains the gap: three product lines in the distributor file, "CHOC 24/CS", "CHOC 12/CS" and "VAN 24/CS", match nothing on your website list, so the dashboard left them out. Its last line reads FIX IT, which means do not use the dashboard yet.
Stay in the same chat window where the dashboard was built, so the original files and the dashboard are both there, and paste this.
Check the dashboard you just built against the files I attached. Do not rebuild it.

For each channel, add up the revenue column in the original file yourself and show the file total next to the dashboard total. Say whether they match, and by how much if not.

For each mismatch, find the rows that explain it: a missing day, a product left unmatched, or revenue counted before deductions in one place and after in another.

Then take the three biggest numbers on the dashboard and show how each was calculated, row by row.

Finish with one line: USE IT if every total matches, FIX IT if any does not.
Your part is the last line of the answer. If it says FIX IT, tell the same chat to correct the lines it named and run the check again.
When a generator is the wrong tool
- The numbers are not in files. If the real total lives in someone's memory or a text thread, the generator has nothing to check against.
- A lender, an auditor or a tax filing will read it. Those numbers should come from your accounting system, and a chat is not one.
- The same dashboard has to exist every week without anyone pasting files. A generator builds one picture from the files in front of it and does not keep running. Someone has to build that once, and it is what the Reporting Sprint does: the weekly readout is built and waiting for you.
Services
Reporting SprintNobody spends their week building the report. You open it and see what is working, what is leaking, and where to push next.
CPG AI Assessment
Fix the CPG workflow that keeps landing back on your desk.
I map the recurring reporting or operating workflow first, then build only when the first useful fix is clear.