By Smári Ásmundsson · · 6 min read
Automated reporting tool: how a CPG founder chooses one and proves it works
Which automated reporting tool should a CPG founder choose, and what must it prove before it gets the weekly numbers?
The report says last week's revenue was higher than your store says it was. Nobody can tell you which one is right, so the weekly meeting turns into an argument about the report instead of the business.
Choose the automated reporting tool by where your numbers live. Then test it before it touches your weekly numbers: its total for last week has to match the export from the source for the same week. Every route below has to pass that one test.
Where the numbers live decides the tool
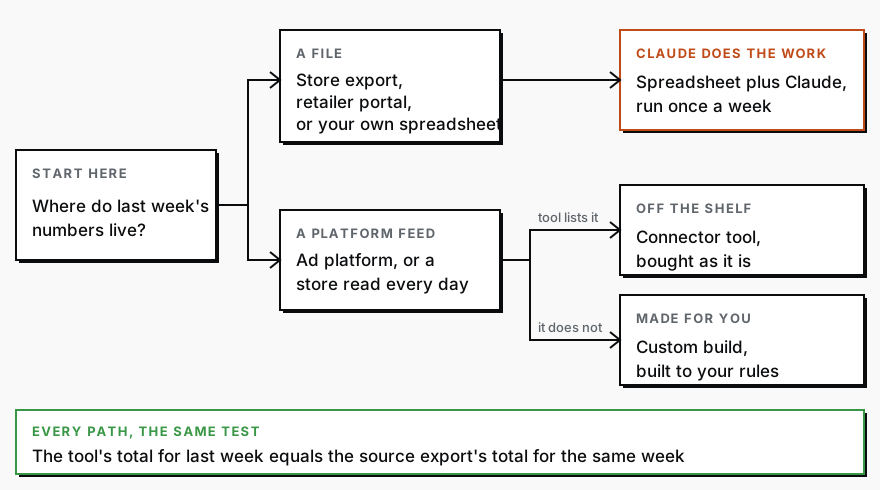
Ask where last week's numbers sit. There are three answers.
They arrive as files: a store export, a download from a retailer portal or distributor, a spreadsheet somebody keeps. Then you do not need to buy anything yet. Once a week, someone drops the files into a chat with Claude, an AI chat assistant like ChatGPT, and Claude builds the sheet.
They sit in a platform that sends its numbers out on its own, like an ad account, and a tool says it works with that platform. Then a connector tool is worth testing. A connector tool is software that copies the numbers out of your platforms for you.
No tool says it works with your platform, or your numbers depend on rules only you use. Then the choice is a custom build, where someone writes the connection for you.
When a spreadsheet and Claude, run weekly, is enough
It is enough when your numbers arrive as files and one or two people read the result once a week. Nothing runs by itself in the first version. On the same day each week, whoever pulls your exports drops them into the same Claude chat and gets the same sheet back. It costs no software and needs no login to anyone's platform. Make it run on its own only after it has matched the source for a month.
This is the right place to start. Ask any tool's vendor to show your retailer portal on the list of platforms it works with before you pay. If it is not on the list, that source is a file, and the file route covers it. The weekly revenue question, answered from two exports walks the file route end to end, and the weekly report on your automatic emails in Klaviyo, an email marketing tool is another report built this way: one line typed once a week, no new software.
What a connector tool does that the weekly Claude routine does not
A connector tool logs in to your store, your ad accounts and similar platforms and copies the numbers into one dashboard on its own. Nobody downloads anything, so the numbers can refresh every day, and your whole team can open the same screen. A routine run by hand cannot do either.
What it does not know is your rules: how you count a refund, which costs belong to which product, what a distributor's deduction does to revenue. The tool counts those its own way, and you find out which way only by testing it. That is why the test below comes before the dashboard and not after. For what the finished dashboard should show once the numbers are right, read the founder CPG dashboard.
How to test that the tool's totals match the source
In the older days you would open the tool, set the dates to last week, and write down its revenue total. Then you would open your store export, add up the revenue column, and compare the two numbers. If they disagree, you go day by day to find where the gap starts, then order by order. That takes about two hours when the totals disagree, and you do it all again whenever the tool or a platform changes something.
Today, give the two files to Claude and you have the answer in a couple of minutes. What comes back looks like this, with illustrative numbers for a week where the tool is wrong:
- Revenue: tool 41,200, export 38,900, gap 2,300 (5.9%).
- Orders: 612 in the tool, 612 in the export, no gap.
- Units: 1,204 in the tool, 1,204 in the export, no gap.
- FAIL. Orders and units match, so the tool has the right orders and counts the money differently. The gap sits on Thursday (1,400) and Saturday (900). Ask the vendor how the tool treats shipping, tax and refunds on those days.
If you sell through distributors, the source export is the distributor's sales file, and the first thing to settle is whether the tool counts revenue before or after their deductions. Whoever pulls your export also downloads the tool's report for the same dates and pastes both into one Claude chat with the instructions below. (A prompt is just the instructions you type in. You can paste this one as it is.) Your part is the last line, PASS or FAIL.
I attached two files for the same week. The first is the weekly report from my reporting tool. The second is the export from the source for the same dates: my store, ad account or retailer portal.

1. Tell me what dates each file covers. If they differ, stop and say so.
2. Find revenue, orders and units in each file. If a file has more than one revenue column, for example before and after refunds, say which one you used and show the others beside it.
3. Add up each file yourself. Do not copy the totals printed in the files.
4. Show a table with the tool's total, the export's total and the gap in dollars and percent, for revenue, orders and units.
5. Say PASS if every gap is zero or under one dollar of rounding. Otherwise say FAIL, show which days the gap sits on, and list the likely causes.

Never fill in a missing number. Show it as missing.
Claude can misread a column, so step 2 makes it name the column it used and step 3 makes it add up the rows itself. A wrong guess then shows up as a gap you can see. A tool that fails does not get the weekly numbers. Send the vendor the table and ask them to explain the gap. Run the same chat again once a month with that month's files, and any time you or the platform change how something is counted. A tool that passed in October can fail in March.
Who gets the report, and what they do with it
One person gets it, and for most seven-figure brands that is you. Name the one decision it feeds: what to reorder, where to cut spend, which account to call. Anyone else on the list should be able to say what they do with it, and if they cannot, take them off. Put the PASS line at the top of every weekly report, so the reader sees that it was checked before they see a number.
If you would rather have the report built and tested against your own exports before it reaches you, that is the Reporting Sprint.
Services
Reporting SprintNobody spends their week building the report. You open it and see what is working, what is leaking, and where to push next.
CPG AI Assessment
Fix the CPG workflow that keeps landing back on your desk.
I map the recurring reporting or operating workflow first, then build only when the first useful fix is clear.