By Smári Ásmundsson · · 6 min read
Computer vision retail analytics: what it can tell a CPG brand about its shelf
Does computer vision retail analytics matter to a CPG brand, and what can it tell you about your shelf?
A buyer asks how your product is doing in her stores, and you answer from your own sales numbers because that is all you have. Software that counts what is on the shelf from photos, sold as computer vision retail analytics, can answer what your sales data cannot. For a consumer packaged goods (CPG) brand your size, the part worth having first does not need a vendor. A few dozen phone photos and a short checklist answer the same questions on a small scale, and AI can score the photos while you do something else.
What does computer vision actually measure on a shelf?
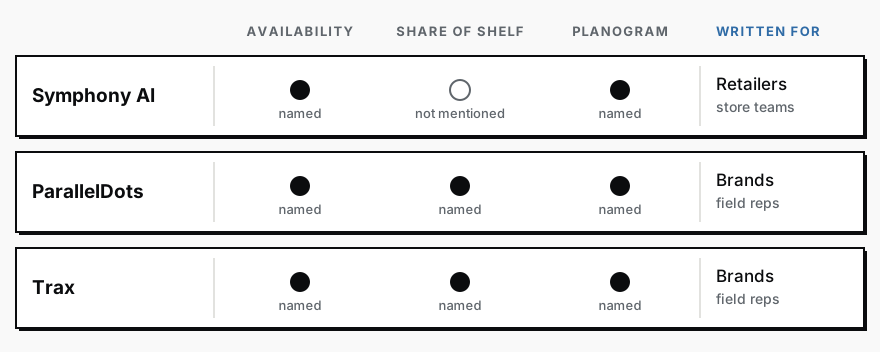
Computer vision is software that looks at a photo and says what is in it. On a shelf, the three vendors I read name the same three measures.
Availability. Is the product there. ParallelDots says it should be confirmed by looking at the shelf, "not inferred from stock records."
Planogram compliance. The planogram is the retailer's map of which product sits where. Compliance is whether the store followed it. Symphony AI puts it as whether products are "in the right position, with the right number of facings." A facing is one pack's front, so three packs side by side is three facings.
Share of shelf. How much of the shelf you hold against every competing brand. ParallelDots says it counts what each competitor holds at that moment, where a manual audit captures only the brand's own facings.
ParallelDots says one photo yields fifteen to twenty separate facts about a shelf. They are these three measures with detail: which product, how many facings, whether the display ran as planned.
What can a brand do with plain shelf photos and AI first?
In the older days you would visit your stores, or ask a rep for photos, and score each one by hand against a checklist: is our product there, how many facings, which shelf, what sits beside it, how many facings does the nearest competitor have. Twenty photos at ten minutes each is over three hours, and then you type it all into a sheet.
Today, you give Claude, an AI assistant, the photos and a set of instructions (a prompt is just the instructions you type in), and a minute or two later you have the same table. This is the shape of what comes back. The numbers are made up, to show the format:
| Photo | Our product | Facings | Shelf | Left / right | Nearest competitor facings | Note |
|---|---|---|---|---|---|---|
| store-1.jpg | yes | 3 | eye level | Brand A / Brand B | 6 | |
| store-2.jpg | yes | 2 | bottom | Brand B / Brand C | 5 | |
| store-3.jpg | no | 0 | n/a | n/a | 6 | gap where we should be |
| store-4.jpg | unsure | n/a | n/a | n/a | n/a | photo too blurry to count |
It then closes with a few sentences you could say to a buyer: *"We are on shelf in most of the stores we could read. In one, the pack sits on the bottom shelf with 2 facings against the nearest competitor's 5. In another there was a gap where we should be."*
To run it, type your product name on the first line of the message, attach the photos with the store as the file name, and paste this underneath:
I have attached photos of store shelves. The file name of each photo is the store. My product is named on the first line of this message.

For each photo, tell me:
1. Is my product on the shelf: yes, no, or unsure.
2. How many facings it has, meaning how many packs sit side by side at the front.
3. Which shelf it is on: top, eye level, middle or bottom.
4. Which brands sit directly to its left and right.
5. Whether there is an empty gap where it should be.
6. How many facings the closest competing brand has in the same section.

Put the answers in one table, one row per photo. Mark anything you cannot read clearly as unsure. Never guess.

Then write three sentences I could say to a buyer about what these photos show, and list the photos too unclear to count.
Whoever already visits your stores takes the photos, or you do on your own rounds. If nobody visits, five stores near you and your own phone make a full first run. Anyone on your team can paste the instructions. Your part is reading the three sentences. A blurry photo comes back marked unsure, so you lose one row, not the table, and it is the one to retake on the next visit.
Who pays for it, the retailer or the brand?
It depends on whose page you read. Symphony AI writes for retailers: store associates scan sections of shelf, and the results go to the teams that plan what goes where. ParallelDots and Trax write for brands, and both are built around a rep walking into stores with a phone or a mounted camera. Trax says the data feeds the conversations where a rep sells a product into a store.
The results on these pages are the vendors' own, and they are thin. Symphony AI reports a 21.3 point gain in planogram accuracy at a Canadian grocer over 12 weeks and a 5.7 point gain in shelf availability at another customer. The page gives no starting figures to compare against and no method, and two of the customers are unnamed. ParallelDots gives no accuracy rate and no customer result on the page I read. Trax's article states no figures. No vendor page I read gives a price. So the question for each is the one the page leaves out:
- To Symphony AI: which of these numbers describes one brand's product, and does the brand get to see it?
- To ParallelDots: how often does it miscount facings on packaging like mine?
- To Trax: what does one store visit cost, and at how many stores does that beat a person with a phone?
Which measure would change a buyer conversation?
The one a buyer can act on without trusting you. Buyers allocate space, so facings against competitors in the same section is the number that bears on the decision. A photo with a gap in it is a better reason to ask about restocking than a complaint about slow sales.
Planogram compliance is stronger still when you have it in writing. If the retailer agreed to four facings and three of your five stores show two, that is a conversation about their execution, not your product. Without an agreed plan it does not exist, so start with availability and facings.
The limit is real. Twenty photos from twenty stores are a sample, and AI can misread a crowded shelf, which is why the instructions tell it to mark what it cannot read. The vendor tools earn their price when you need every store, every week, without a person in the loop.
Once the photos are a table, they belong in the same weekly view as your other numbers. That is the reporting work AI for CPG brands starts with, and the founder's dashboard shows what goes on it. When two sources disagree, which number is right comes first. If you would rather nobody on your team builds that view each week, that is what the Reporting Sprint is for.
Services
Reporting SprintNobody spends their week building the report. You open it and see what is working, what is leaking, and where to push next.
CPG AI Assessment
Fix the CPG workflow that keeps landing back on your desk.
I map the recurring reporting or operating workflow first, then build only when the first useful fix is clear.