By Smári Ásmundsson · · 7 min read
Safety stock inventory: how much a CPG brand needs and how AI keeps it current
How much safety stock inventory does a CPG brand need, and how can AI keep the number current?
The order you placed arrives two weeks late, the shelf has been empty for nine days, and the reorder number you used was right on the day you set it. The number was not wrong. It was set once, and your co-packer's delivery times kept moving.
How much safety stock a CPG brand needs comes down to two measurements per product: your busiest recent week of sales, and your longest recent delivery. In the example below, one product needs 1,500 units of cushion and an order point of 3,500. AI can recalculate both every week from your weekly sales and your receiving dates. You confirm the few inputs it cannot know.
What is safety stock and how is it different from a reorder point?
Safety stock is the extra inventory you keep for the case where sales run higher than usual or an order arrives later than usual. The reorder point is the stock level at which you place the next order. One is a cushion, the other is a trigger, and the cushion is part of the trigger.
The reorder point is what you expect to sell while the order is on its way, plus the cushion. Take a product that sells 400 units a week, with an order that usually takes 5 weeks. You expect to sell 2,000 units while you wait. A reorder point of 2,000 has no cushion in it at all. Every number in this page is illustrative and describes no real business.
How much safety stock does this product need?
Start with two numbers you can read off your own records. The first is demand: the product sells 400 units in an ordinary week and 500 in its busiest ordinary week. The second is delivery: your last six orders from the co-packer took 4, 4, 5, 5, 5 and 7 weeks, so the average is 5 and the longest is 7.
Here is a simple way to set the cushion. Multiply the busiest week by the longest delivery, then subtract what you expect to sell in a typical wait.
- Busiest week times longest delivery: 500 × 7 = 3,500 units.
- Typical week times average delivery: 400 × 5 = 2,000 units.
- Safety stock: 3,500 − 2,000 = 1,500 units.
- Reorder point: 2,000 + 1,500 = 3,500 units.
This method assumes your busiest week and your slowest delivery arrive together, so it errs on the high side. It is a good place to start because you can check every step with a calculator, and a number you can check is a number you can adjust. Why stock belongs next to revenue in the first place is covered in Inventory risk should show up before it gets expensive.
How does a variable co-packer lead time change the number?
Lead time, the weeks between placing an order and having the stock, is the half of the cushion that is easy to skip. If you plan on the average of 5 weeks, the reorder point is 2,000 units. When an order takes 7 weeks, the product sells 2,800 units at 400 a week while you wait, so the shelf is empty for the last two weeks. Planning on the longest delivery is what closes that gap.
Use the delivery times from your own receiving dates, not the quote. A quote tells you what was promised. Your received dates tell you what happened, and the longest of the last six is the number the cushion has to survive. Each week you paste the latest six orders, so one bad delivery moves the number the week it lands rather than the week after the stockout.
How do you handle a promotion spike?
Keep it out of the cushion. A planned promotion is a known extra, not a surprise, and the cushion is only for surprises. If the promotion week stays in your sales history, it becomes your busiest week, and it stays your busiest week until it ages out of the weeks you look at.
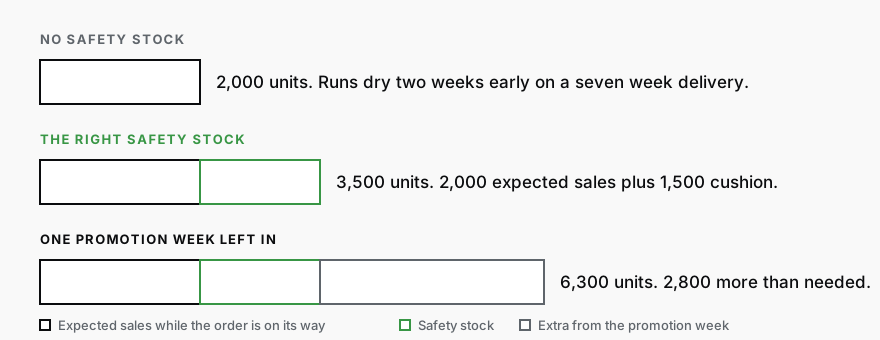
Say a promotion week sold 900 units. Left in the history, the cushion becomes 900 × 7 − 2,000 = 4,300 units, almost three times the 1,500 above, and the reorder point climbs to 6,300. That is a lot of cash sitting in a warehouse to protect against a week you already knew about.
Plan the promotion on its own line instead. If the retailer's two-week promotion is expected to sell 900 units a week against the usual 400, the extra is 2 × (900 − 400) = 1,000 units, on hand before it starts. You supply the promotion dates and the expected lift. The AI does not guess the lift, because it has never seen your buyer's shelf.
What should AI recalculate each week, and what should a person confirm?
The AI does the arithmetic, every product, every week, from your weekly sales export, the spreadsheet your system downloads of units sold by week:
- Drop the promotion weeks, then find average and busiest weekly sales.
- Find average and longest delivery from the last six orders.
- Calculate safety stock and reorder point, with the steps shown.
- Add the planned promotion extra as its own line.
- Recompute each figure from the raw numbers and list any product it cannot support as "ask me".
- Show anything that moved more than 10 percent first.
The flags that tell you which products run out soonest come from How to use AI for inventory management in a CPG brand without trusting its first forecast, and this page sets how much cushion each one needs. The same weekly export habit is in The weekly revenue question, answered from two exports.
A person confirms the four things the export cannot tell the AI: the expected lift of any promotion, a delivery date the co-packer has changed, any product with under eight ordinary weeks of sales or fewer than four orders on record, and the order itself, including the minimum order size and the cash. Whoever places your orders can paste the export. Your part is the four confirmations.
The recount is the same AI reading the same figures a second time. It catches an arithmetic slip and a dropped product. It cannot catch a wrong delivery date in your receiving log, which is why every figure arrives with its working beside it.
If you would rather not paste an export each week, Reporting Sprint is our setup of a weekly readout that runs without you.
Turn a weekly export into safety stock
In the older days you would open the sales export in a spreadsheet, delete the promotion weeks, work out the average and the busiest week for each product, dig out the received dates of the last six orders, subtract, multiply, and copy the result next to each product. For a brand with forty products, call it about three hours, an illustrative figure. And three hours later you have a sheet that is out of date by the next delivery.
Today, give this to Claude, an AI assistant you can type to like a colleague, and you have every product's numbers in about a minute. (A prompt is just the instructions you type in; you can paste this one as it is.) Paste your weekly sales under it, then your last six order and received dates for each product, then your promotions, past and planned. What comes back for each product looks like this, and again the numbers are illustrative:
- Product A: average 400 a week, busiest 500. Average delivery 5 weeks, longest 7. Safety stock 1,500. Reorder point 3,500. Promotion extra 1,000.
- Product B: ask me. Five weeks of sales and two orders of history is too little to give a number.
Next week, paste the new export into the same chat and it shows what moved.
You are helping the owner of a small food and beverage brand who is not technical. Use plain English and explain any term in the same sentence you use it.

Below these instructions are three things, pasted as text: the weekly sales by product (units sold each week, for the last 12 weeks if you have them), the order date and received date of the latest orders for each product, and the promotions, past and planned (product, which weeks, expected units per week). For every product, do this:

1. Leave out every week that was a promotion. Using the other weeks, find the average weekly units sold and the highest weekly units sold.
2. From the latest six orders, find the average lead time and the longest lead time in weeks. Lead time is the weeks from placing an order to receiving it.
3. Safety stock = highest weekly units times longest lead time, minus average weekly units times average lead time. Reorder point = average weekly units times average lead time, plus safety stock. Show the arithmetic.
4. For any planned promotion, add a promotion extra on its own line: (expected promotion units per week minus average weekly units) times the number of promotion weeks. Never include it in safety stock.
5. Check yourself. Recompute each figure from the raw numbers. Put any product with a short history in an "ask me" list instead of giving a number. A short history means under 8 weeks of ordinary sales or under 4 orders. Never treat a missing week as zero sales.

Show one line per product: safety stock, reorder point and promotion extra. Put any product whose safety stock moved more than ten percent from earlier in this chat first. Do not tell me whether to order. That is my decision.Services
Reporting SprintNobody spends their week building the report. You open it and see what is working, what is leaking, and where to push next.
CPG AI Assessment
Fix the CPG workflow that keeps landing back on your desk.
I map the recurring reporting or operating workflow first, then build only when the first useful fix is clear.