By Smári Ásmundsson · · 6 min read
Retail analytics platforms: how a CPG brand chooses one
How should a CPG brand choose among retail analytics platforms?
A buyer asks how your item sold in her stores last week, and you do not have the number. A platform rep has a demo ready, and the first screen is a dashboard that looks like the answer. Choose among retail analytics platforms with four questions the platform has to answer for your brand: how many units sold, how many stores carry the item, what a promotion added, and how old the newest week of data is. Put the platform's own demo numbers through those four before you pay. If your own files already answer all four, a weekly report an AI builds from them may be all you need.
Which questions should a platform answer for a CPG brand?
Four. Each one has a test you can run on the demo numbers and a sign that the platform has failed it.
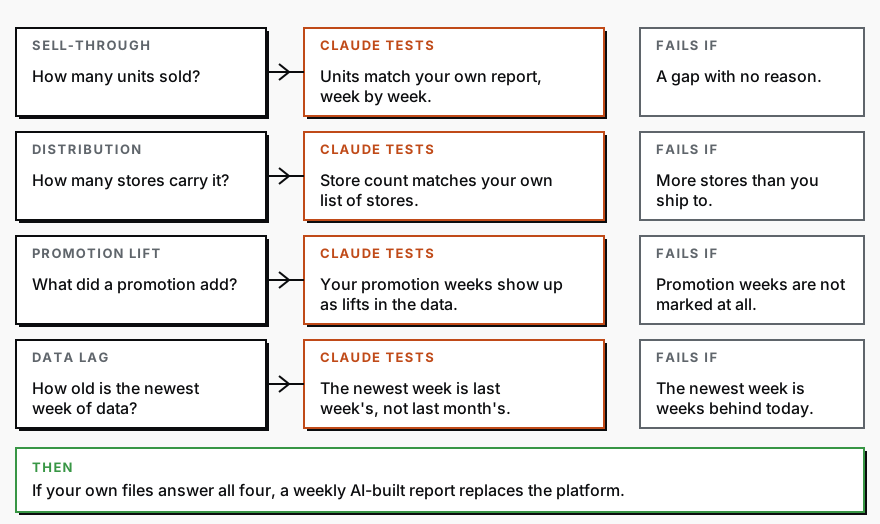
Sell-through is how many units sold, store by store and week by week. Your distributor's report may count units sold to stores, while a platform may count units sold to shoppers, so the first thing the test finds out is what each file counts. Where both count the same thing, the units should match week for week. A small gap you can explain is fine. A gap nobody can explain is the platform counting something other than what you think it counts.
Distribution is how many stores carry the item. This one decides everything downstream, because every per-store number divides by it. The same units give 2.5, 3.3 or 5 per store per week (illustrative numbers), depending on which stores you count. The test is whether the platform's store count matches your own list of stores that ordered. More stores than you ship to is the sign it is counting differently.
Promotion lift is how much more sold in a promotion week than in an ordinary one. The test is whether the weeks you ran a promotion show up as lifts in the platform's data. If your promotion weeks are not marked at all, the platform cannot tell you what a promotion added.
Data lag is the gap between a sale and the day it appears. The test is the date on the newest week in the demo. The sign of failure is a newest week that is weeks behind today.
How do you test a platform before paying?
Ask the rep for the demo numbers on one of your own items, or a sample export you can open as a file, covering a few months. Then put it beside your distributor's report for the same item and weeks. If you sell mostly direct and on Amazon, use your store and Amazon exports in place of the distributor report; the four questions are the same.
In the older days you would do that by hand. Open both files, line the weeks up, add up the units, count the stores in each, find your promotion weeks and compare the lift, then look at the date on the last row. Say four hours for each platform you are weighing, and an argument with the rep at the end about which file is right.
Today, whoever pulls your distributor report pastes the instructions below into Claude, an AI chat assistant like ChatGPT, with both files underneath, and has the answer in a minute or two. Your part is reading it. This is what comes back, with invented numbers to show the format:
| Question | Distributor report | Platform demo | Result |
|---|---|---|---|
| Units sold, 12 weeks | 1,200 | 1,310 | Close |
| Stores carrying the item | 40 | 52 | Does not match |
| Promotion weeks and lift | 2 weeks, 60% more units (illustrative) | Not marked | Does not match |
| Latest week ends | Nov 8 | Oct 18 | Three weeks behind |
A "close" or "does not match" is not a verdict on the platform. It is a question for the rep, and the answer goes in writing. Claude also drafts those questions. Paste the two files under the instructions, and keep the platform's name out of them so the answer is about the numbers:
Below are two sets of numbers for the same item over the same weeks. The first is the sales report from my distributor. The second is the demo export from a retail analytics platform. Start by stating what each set says it counts, such as units sold to stores or units sold to shoppers. Then compare them on four questions. Sell-through: do units sold match week by week, and where do they differ? Distribution: how many stores does each set show carrying the item? Promotion lift: which weeks in each set are promotion weeks, and how many more units sold in those weeks than the average of the other weeks? Data lag: what is the date of the latest week in each set? For every question, show both numbers side by side, then write Matches, Close, or Does not match. Do not say which platform to buy. Finish with the questions I should send the platform wherever the answer is Close or Does not match.What does the data lag hide?
A platform that is three weeks behind still looks current on the screen. The chart ends where the data ends and nothing marks the gap.
Three things hide in that gap. A store that dropped your item two weeks ago still looks like it carries it. A promotion that ended last week has no lift to read yet, so you cannot say whether it worked before the next one is planned. And a stock-out that started ten days ago is invisible until it is old news. You are answering a buyer's question from numbers older than the question.
Which number is right? is about the meeting this produces: two reports with different dates, and the meeting spent on which one to believe.
When is a weekly AI-built report enough?
When your numbers already arrive as files, you can read the result once a week, and the four questions above are the ones you need answered. Then the platform is a second copy of data you hold. Each week, whoever pulls your distributor report drops it into the same Claude chat and gets the same sheet back, with the store count and the promotion weeks stated the way you chose. Automated reporting tool: how a CPG founder chooses one and proves it works gives the test that any tool has to pass, which is that its total for last week equals the source file's total.
A platform earns its fee when the data you need is not available to you as a file at all. Then it may be the only way to get it, and the four tests above are how you choose between two of them.
If you want that weekly readout running without anyone pasting files, that is the Reporting Sprint, a fixed piece of work where I set up one weekly readout of your numbers.
Services
Reporting SprintNobody spends their week building the report. You open it and see what is working, what is leaking, and where to push next.
CPG AI Assessment
Fix the CPG workflow that keeps landing back on your desk.
I map the recurring reporting or operating workflow first, then build only when the first useful fix is clear.