By Smári Ásmundsson · · 6 min read
Sales dashboard KPI: which ones a CPG brand tracks across channels
Which sales dashboard kpi should a CPG brand track across DTC, Amazon and retail?
The weekly sales number says up 7%. Then somebody opens the website report and finds orders down 8%, and the 7% turns out to be one distributor reorder.
The sales KPI to lead with is net sales for each channel, kept on its own line, with one demand number beside it that shows whether shoppers are actually buying: orders on your own website, units on Amazon, store scans at retail. Add the channels together only as the last line of the table, never as the headline.
The figures below are invented, to show the method.
The same word means three different things
A brand selling on its own website (direct to consumer), on Amazon and through a distributor into stores reads three exports each week (the files each system lets you download), and each one calls something "sales".
In this example brand's files:
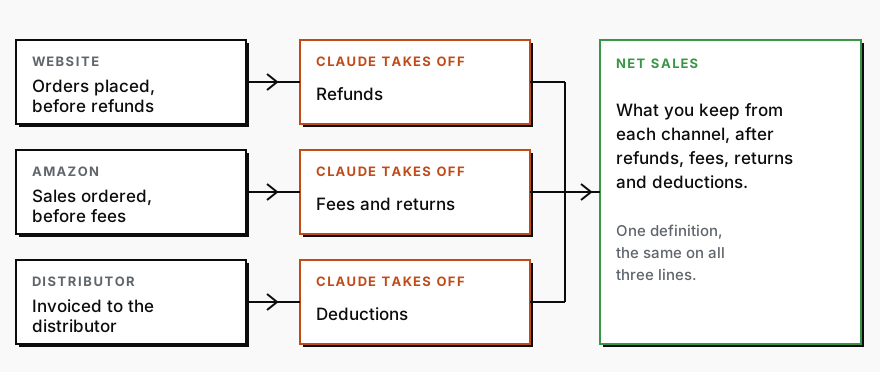
- The website export counts an order at the value it had when the customer placed it, before refunds.
- The Amazon export counts what was ordered, while the fees and returns come in a separate file.
- The distributor file counts what the brand invoiced the distributor, with deductions listed beside it. A second file shows the units that scanned at the register, called store scans.
So "sales" is money before refunds on one channel, money before fees on the second, and what you billed the distributor on the third, which is not what shoppers bought. Net sales fixes that by using one definition everywhere: what you keep from that channel after refunds, fees, returns and deductions come off.
What comes back
Here is the same week, last week against this week, once the three exports are on one definition.
| Channel | Net sales this week | Net sales last week | Change | Demand number |
|---|---|---|---|---|
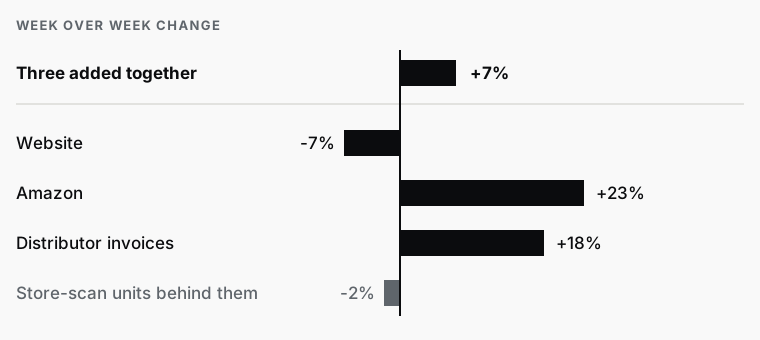
| Website | $46,100 | $49,700 | -7% | Orders 960, down 8% |
| Amazon | $21,600 | $17,600 | +23% | Units 1,350, up 23% |
| Distributor into stores | $40,950 | $34,580 | +18% | Store-scan units 5,150, down 2% |
| All three added together | $108,650 | $101,880 | +7% | |
The last line is the number most weekly reports lead with, and it is up 7%. Read down the rows and the week looks different. The website, the channel where the brand owns the customer, shrank. Amazon grew on real units. The distributor line grew by 18% while the units shoppers bought at the register fell by 2%, which means more of your product is sitting in the distributor's warehouse or on store shelves than shoppers have bought.
When a blended number misleads
A blended number misleads whenever you use it to ask whether demand is growing. It is a sum of channels that count different things at different moments, so one channel's timing can cover another's decline. Here a single distributor reorder carried the total while the website fell.
The cost shows up later. If invoices keep outrunning store scans, the next reorder is likely to be smaller, and by then the blended line has shown "growth" for several weeks.
It does not mislead when the question is only how much money came in. If all three channels are on net sales and you want cash for the week, the total is the right number. The mistake is reading a cash number as a demand number. It is also why a figure can change two days later: why the number you reported changes two days later covers the three causes.
Which KPI leads the weekly review
Lead with net sales by channel, three lines, side by side. The demand number sits beside each one because net sales alone can still flatter a channel, as the distributor line did. Orders, units and store scans are different words for the same question: did a person buy this? The rows are whichever channels you sell through. A brand selling through brokers, foodservice or a regional grocer keeps the same shape: one row each, net sales, and the demand number that channel reports. The founder's CPG dashboard covers what else belongs on the page once this table is trusted.
Everything else is a second-week addition. Amazon advertising cost, for example, sits in another file in this example, and it belongs on the table once the first version is trusted. Start with three rows, a change column and a demand column.
How AI builds the per-channel table
In the older days you would open each export, find which column held the money, subtract refunds from one file, fees from another and deductions from a third, match the product names that never agree, add up each channel and then do the whole thing again for the week before. Three hours later you have a table. Next week it starts from zero.
Today you hand the files to Claude, an AI chat assistant like ChatGPT, and you have the table in a couple of minutes. (With only two channels, the weekly revenue question, answered from two exports is the shorter version.) Open a new chat, attach both weeks of all three exports, and paste the block below. (The block is the instructions you type in. You can paste it as it is.)
I attached this week's and last week's sales files from three places: my website orders, my Amazon reports and my distributor's invoice and store-scan files.

Build one table with a row per channel: net sales this week and last week, the change, and one demand number (orders for the website, units for Amazon, store-scan units for the distributor).

Net sales means what I keep from that channel: take off website refunds, Amazon fees and returns, and distributor deductions. Tell me which file each figure came from.

Add the three channels together on a separate last line. Then write three sentences on where that total hides a channel moving the other way.

Add up the rows in each original file and show me that every figure matches. Never fill in a missing figure or day. Show it as missing.
Whoever pulls your weekly exports attaches the files and pastes the block. The chat can misread a column, which is why the block asks it to name the file behind every figure. Next week, paste the new files into the same chat and ask for the same table. Your part is the last step: read the three sentences, then look at the row that moved against the total. If a row's total does not match its file, the chat says by how much, and that gap is the question to chase before you trust the table. If you do not have store-scan data yet, drop that column and the other two rows still work.
If you would rather have the weekly readout built and waiting when you open it, that is what the Reporting Sprint does.
Services
Reporting SprintNobody spends their week building the report. You open it and see what is working, what is leaking, and where to push next.
CPG AI Assessment
Fix the CPG workflow that keeps landing back on your desk.
I map the recurring reporting or operating workflow first, then build only when the first useful fix is clear.