By Smári Ásmundsson · · 4 min read
Before you answer a buyer's velocity number, check which stores it counts
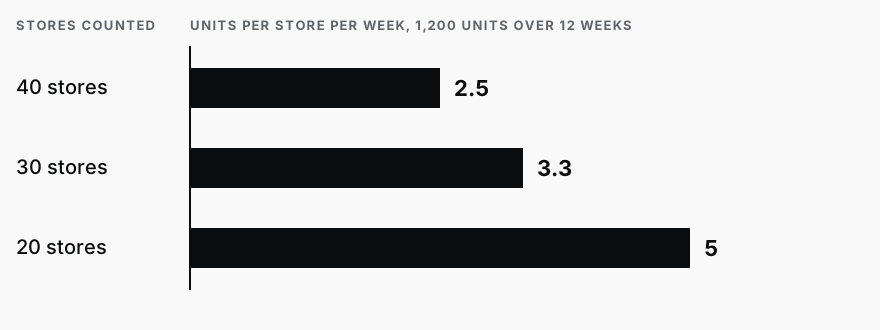
A buyer says an item has to sell 3 units per store per week. On illustrative numbers, the same 1,200 units over 12 weeks is 2.5 or 3.3 depending on which stores you count.
A buyer tells you an item has to sell 3 units per store per week. Your distributor's sales report is open in the other tab, and you cannot tell from it whether you are above or below.
The number is units sold, divided by the stores, divided by the weeks the report covers. The division is easy. The stores are the trap, because the same report gives you two different answers depending on which ones you count.
Say a report shows 1,200 units over 12 weeks (illustrative numbers). Counting all 40 stores that carried the item, it sells 2.5 units per store per week, 83% of the buyer's 3. Count only the 30 that sold at least one unit and it sells 3.3, above the buyer's number. Same units, same weeks, and you are either behind the buyer's number or ahead of it.
Ask the buyer which stores they count
Your number only compares with the buyer's if you count stores the way the buyer does. Ask before you reply: does their number divide by every store that carried the item, or only the stores that sold some? Then count yours the same way, and say which one you used when you answer. If the buyer will not say, give both numbers and label them.
The sum treats every store and every week as equal, and a real report is not that tidy.
A store that got the item halfway through the report is divided as if it had it for all 12 weeks, which pulls your number down. A week with a promotion in it pushes your number up. Neither is wrong to report. Both are worth saying out loud when the buyer compares your figure with a number built a different way.
Counting only the stores that sold also hides the stores that sold nothing, and those are the ones to ask about. That is why the second count is worth having next to the first, not instead of it.
What the gap is worth in units
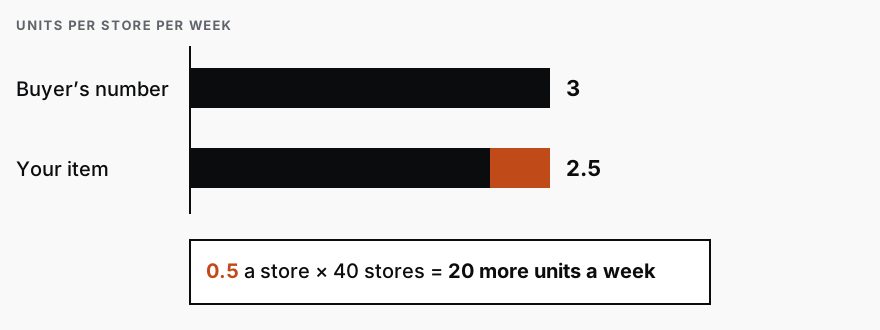
A gap of half a unit per store per week sounds like nothing. Multiply it by the stores and it becomes a target. (The free calculator on our site does this sum for one item at a time, and it shows the gap in units a week at the bottom.)
Take the 40-store count. The buyer's 3 minus your 2.5 is 0.5 units per store per week, and 0.5 times 40 is 20 more units a week across those stores. That is the number to bring to your broker or your sales lead, and the next report will show whether you reached it.
If you are at or above the buyer's number, the same sum tells you that and you can stop. A number you are already beating is a reason to ask what the buyer wants next, and the answer will not be on the report.
The old way, and the way to do it now
In the older days, someone on your team opened the distributor's report in a spreadsheet. They added up the units for each item, counted the stores for each one, divided by the weeks, and then did the same sum a second time with the stores that sold nothing taken out. Twenty items is an afternoon, and it has to be redone when the next report arrives.
Today, give the job to Claude and a whole report can come back in a minute or two. Claude is an AI chat assistant like ChatGPT, and these instructions work in either. (A prompt is just the instructions you type in, and you can paste this one as it is.)
I sell packaged goods through a distributor. Below this message I will paste a sales report. My message ends with the buyer's number, in units per store per week. If the buyer's number is missing, or the report has no store count or no date range, ask me before you start.

For every item in the report, work out units per store per week: the units sold, divided by the number of stores, divided by the number of weeks the report covers. Give it twice, side by side: once counting every store that carried the item, and once counting only the stores that sold at least one unit.

For each count, show how far the item is above or below the buyer's number as a percent, and how many more units a week across those stores it would take to reach it. If the report shows an item reaching a store partway through the period, say so for that item. Write "at or above" if an item already meets the number. Do not estimate sales and do not use any industry average. Return one table with the items furthest below the buyer's number first, and show your arithmetic for the first row.
Your ops lead, or whoever pulls your distributor report, pastes it under this with the buyer's number on the last line, and Claude does the whole report, where the calculator does one item. Claude can misread a line of a pasted report, so put the three items furthest below the number through the calculator before you quote them to the buyer. For each of those items, bring the units a week it needs and the store count you used, so the buyer can see you counted the way they do.
Services
Reporting SprintNobody spends their week building the report. You open it and see what is working, what is leaking, and where to push next.
CPG AI Assessment
Fix the CPG workflow that keeps landing back on your desk.
I map the recurring reporting or operating workflow first, then build only when the first useful fix is clear.