By Smári Ásmundsson · · 5 min read
Retail store analytics: what a CPG brand should have AI report each week
What does retail store analytics tell a CPG brand about its stores, and what should AI report each week?
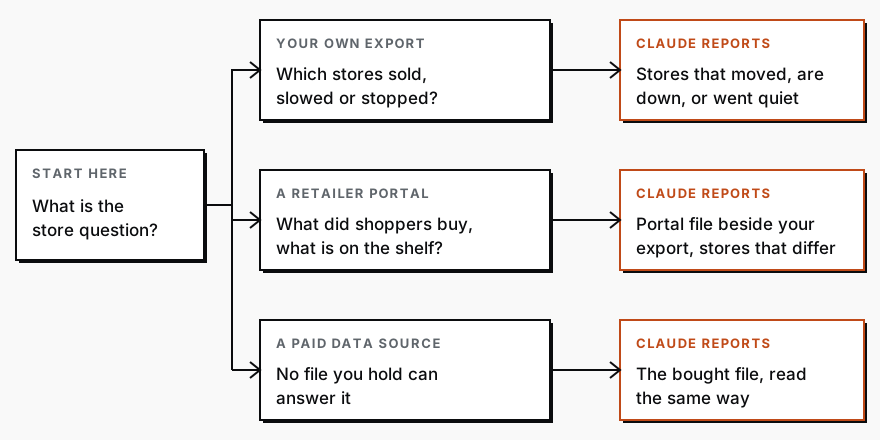
A buyer asks which of your stores have gone slow, and all you have is one total for the item. Retail store analytics comes down to a few questions about each store: did it sell your item this week, did it sell less than usual, did it stop. Your own sales export can answer those for the stores it lists. A retailer's portal adds what shoppers bought and what is on the shelf. Have AI read your export every week and hand you the stores that need a question.
Which store-level questions can a brand answer from its own data?
Any question the rows of your export can settle. That means a report with one row per store per week and the units sold. Check yours for a store column and a week column first, and if it has none, ask whoever sends it for the store-level version.
From that export, AI can answer three things for every store. How many units it sold last week. How that compares with its own last four weeks. Whether it sold anything at all after selling steadily before. Those are enough to separate a store that moved product from one that needs a question.
What the export cannot tell you is why. A store that went quiet may have dropped the item, run out, or simply not reordered. It also may count units sold to the store rather than units sold to shoppers, so first find out which one your file counts. Decide which stores count before you compare anything, because the same units give a different number per store per week depending on which stores you count.
What does a retailer portal show that your own export does not?
The shopper's side and the shelf. Some retailer portals, Walmart's Luminate among them, offer suppliers a store and item report of sales and inventory, so you can see what shoppers bought and what the store holds, not only what shipped to it. Look at what your own retailer's portal offers. Where it does, it can answer "did the item sell through, or is it sitting there?", which your export cannot.
Take the portal's weekly store file and put it beside your export. Where the two disagree about a store, that is the store to ask about. Check the date on the newest week in each, because a portal can lag, and a store that dropped your item two weeks ago still looks fine if the data stops before then. Which number is right? is about the meeting you get when two reports carry different dates.
Only some retailers give you a portal. For the rest, a paid data source that sells store-level sales is the third branch, and it is worth the fee only when a buyer is asking for numbers you cannot get from a file you already hold.
What does a weekly store report need to flag?
Four things, each as one line a person can act on.
- Down: stores selling well below their own recent average, with both numbers shown.
- Went quiet: stores that sold in earlier weeks and sold nothing this week.
- New: stores that sold for the first time, so a launch is visible.
- How old the data is: the date of the newest week, at the top, so nobody reads old numbers as current.
Each flagged store gets a question, never a conclusion. "Is the item still on the shelf?" is a question. "This store dropped you" is a guess.
The weekly report, built once
In the older days you would open the export, sort it by store, work out each store's average for the four weeks before, then compare this week against it and scan for stores at zero. Say two or three hours every week for forty stores, and again every time the file changes shape.
Today, whoever pulls your distributor report pastes the instructions below into Claude, an AI chat assistant like ChatGPT, with the export under them. The answer takes a minute or two, and your part is reading it. This is what comes back, with invented numbers to show the format:
| Store | This week | Average of the four weeks before | List |
|---|---|---|---|
| Store 07 | 0 | 6 | Went quiet |
| Store 12 | 3 | 8 | Down |
| Store 03 | 9 | 7 | Moved |
| Store 19 | 4 | 0 | New |
Under each store that went quiet or is down, Claude adds the question to ask. For Store 07: "Did the order arrive, and is the item still on the shelf?" Next week, paste the new export into the same chat.
Below is my sales report, one row per store per week, with the units sold. For each store, work out this week's units and the average of the four weeks before it. Then sort the stores into four lists. Moved: units this week at or above the store's own average. New: no sales in the four weeks before and some this week. Down: units this week at least 30 percent below its own average, with both numbers shown. Went quiet: sold in at least two of the four weeks before and sold nothing this week. Put Went quiet and Down first, one line each, with the question I should ask about that store. Begin with the date of the newest week in the report. If a store has fewer than four weeks of history, say so and leave it out of the four lists. Do not guess why a store is down. If the report has no store column or no week column, tell me before you start.If you want that report arriving every week without anyone pasting a file, that is the Reporting Sprint, a fixed piece of work where I set up one weekly readout of your numbers. For choosing between a platform and a report built from your own files, Retail analytics platforms: how a CPG brand chooses one gives the four questions to put to a platform.
Services
Reporting SprintNobody spends their week building the report. You open it and see what is working, what is leaking, and where to push next.
CPG AI Assessment
Fix the CPG workflow that keeps landing back on your desk.
I map the recurring reporting or operating workflow first, then build only when the first useful fix is clear.