By Smári Ásmundsson · · 6 min read
Sales report template Word: what a CPG brand puts in it and lets AI fill
What should a sales report template in Word hold for a CPG brand, and can AI fill it each week?
Somebody on your team rebuilds the weekly sales report by hand. The distributor file is open in one window, the website orders in another, and the Word document is last week's with the numbers typed over. It comes out a little different every time.
A sales report template for a CPG brand needs six fields: one headline line, a table by channel, the top and bottom three products, a note on each retailer that moved, one decision needed, and a list of every number the report could not source. AI can fill all six from the sales files you already download each week. The sixth field is what stops it from inventing anything.
Which sections does a CPG sales report need?
Five that change what you do this week, plus the list of gaps.
- Headline line. Total revenue this week, last week's total and the change. One sentence.
- Channel table. One row per channel (your website, Amazon, each distributor or retailer you sell to directly) with revenue, orders and the change against last week.
- Top and bottom products. Three of each by revenue, so you see what carried the week and what stalled.
- Retailer notes. One line for each retailer or distributor whose revenue moved more than 20 percent either way.
- One decision needed. A single question for you, with the numbers behind it.
- Not sourced. Anything the report wanted to say that the files could not support.
Drop whatever would not change a decision this week: year-to-date totals, a chart for every metric, advertising detail, a paragraph of commentary on each channel. Those belong in a monthly review. A live view for the founder is a different page, covered in what should actually be on a founder's CPG dashboard.
What does the report look like when AI fills it?
Here is one week, with illustrative numbers.
Headline. Revenue was $72,980 this week against $71,200 last week, up 2.5 percent.
| Channel | Revenue | Change | Orders |
|---|---|---|---|
| Website | $18,420 | +7.7% | 412 |
| Amazon | $22,910 | -5.7% | 538 |
| Distributor | $31,650 | +6.2% | 14 |
Top three. Chocolate 12-count $21,300, Variety pack $17,900, Original 12-count $14,200. Bottom three. Mini 4-count $3,040, Sampler $2,650, Sea salt 6-count $2,100.
Retailer notes. One regional chain in the distributor file ordered $9,800 against $6,200 last week, up 58 percent.
One decision needed. Chocolate 12-count sold 37 percent more than last week. Do you move its next reorder up?
Not sourced. The Amazon file has no rows for Saturday, so Amazon revenue may be understated. Inventory on hand is in none of the files, so the reorder question rests on sales alone.
That last field is the point. A file that arrives short reads as a sales drop, and a report that fills the gap quietly passes the drop along as fact. This one says what it could not support, and you read that list first.
How does AI fill the report without inventing a number?
In the older days your ops person would download the distributor file, the Amazon report and the website orders. They would paste them into one sheet and rename the distributor's product codes to your own names. Then they would add up each channel, sort for the top and bottom, and hunt through the files for the retailers that moved. Last, they would type all of it into the Word layout and write the decision line from memory. For three channels that is about three hours, and it starts from zero again next week. The weekly revenue note describes the same morning.
Today you give Claude, an AI chat assistant like ChatGPT, the same exports plus the instructions below, and the report comes back in a couple of minutes. (The instructions you type into the chat are called a prompt. You can paste these as printed.)
Whoever pulls your distributor export each week runs it. Download each channel's export for the last two weeks, open a new chat, attach the files and paste this underneath:
I attached this week's sales exports for my brand, one file per channel. Each file covers this week and the week before. Build my weekly sales report in exactly this layout and order, even when a section has nothing to say (write "Nothing this week"):

1. Headline: one sentence with total revenue this week, last week's total and the change in percent.
2. Channel table: one row per channel with revenue, orders and the change in revenue against last week.
3. Top three and bottom three products by revenue. The files name the same product differently, so match them and list every match you made.
4. Retailer notes: one line for each retailer or distributor whose revenue moved more than 20 percent either way.
5. One decision needed: one question for me, with the numbers behind it.
6. Not sourced: every number or statement you wanted to make and could not support from the files, with the reason.

Before you write, add up the rows in each file yourself and check that each channel total matches its file where the file carries one. If a file is missing days, say which ones. Never fill in a missing number or a missing day. Put it in section 6.
Your part is reading the answer, starting with section 6. Paste the report into your Word document under the same six headings.
Two things in those instructions do the work of keeping it honest. Claude is told to add up each file's rows itself and check each channel total against the file. A total that does not match is named before it reaches the table. And the product matches are written out, so a wrong match takes thirty seconds to spot.
How do you keep it the same shape every week?
Save the instructions once and paste the same words every week. The layout lives in them, so the report cannot drift into a new shape because someone was in a hurry.
The line "write Nothing this week" matters for the same reason. If a section disappears when it is empty, you cannot tell whether nothing moved or nobody looked. A report with six headings every week lets you read the same place for the same thing, and the week that changes is the week you notice.
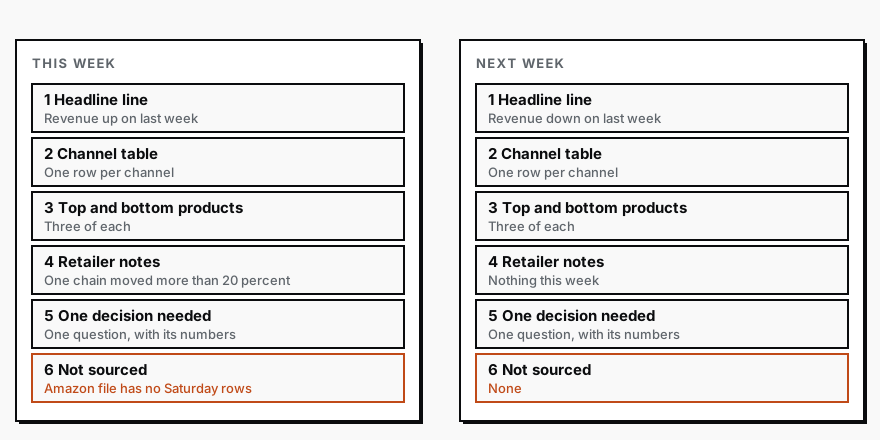
If you want to change the layout, change the saved instructions and not the finished report. Then the change shows up in every later week.
Who should receive it, and what should it end on?
Send it to you and to the person who owns the decision on the last line. Add another reader only when a line in the report is theirs to act on. Each extra reader brings questions about the numbers, and the report already answers those in section 6.
It ends on one decision because a report that ends on a summary asks nothing of the reader, and one that ends on a question with an owner gets answered at the next meeting. Claude drafts the question from the table. You or your ops person decides it, and the draft will say when the files could not answer part of it, as it does for inventory above. It gives the weekly meeting one page to open on, which is the argument in your weekly meeting should not start with "which number is right?".
If nobody on your team has the hours to run this every week, the Reporting Sprint is how Nordic Navigators builds a weekly readout that is waiting when you open it.
Services
Reporting SprintNobody spends their week building the report. You open it and see what is working, what is leaking, and where to push next.
CPG AI Assessment
Fix the CPG workflow that keeps landing back on your desk.
I map the recurring reporting or operating workflow first, then build only when the first useful fix is clear.