By Smári Ásmundsson · · 6 min read
What is sell-through rate, and how does a CPG brand read it each week?
What is sell-through rate, and how should a CPG brand read it each week?
A buyer tells you your item is moving fine, and you still cannot tell whether to ask for a reorder or wait.
Sell-through rate is the share of the stock a store could have sold that it did sell. Take what the store held at the start of the week and add what arrived during the week. Call that total the units available. Units sold divided by units available is the rate. A store with 300 units available that sells 120 has a sell-through rate of 40% (illustrative numbers). Other definitions exist, and this one needs only the two files below. Read every week, it shows which products are about to run out and which are piling up, before either shows in an order.
The two exports it needs
The calculation needs two exports, which are spreadsheet files you download or pull from your own invoices. One lists what you shipped to the retailer, by date and product, and comes from your own invoices or your distributor's report. The other lists what the retailer sold to shoppers, by week and product, and comes from whichever report the retailer or distributor shares with you. If you can only get one of the two, you cannot do this, and it is better to find that out before you argue about a reorder.
A worked example: two products, four weeks
Here is one retailer, two products, four weeks, with illustrative numbers. For each product the stores start week 1 holding 200 units, and you ship 100 a week.
Each week uses the same three steps. Add what the stores held to what you shipped to get the units available. Divide the units sold by the units available. Subtract the units sold to get the units left, which is where the next week starts. For Product A in week 1, 200 held plus 100 shipped is 300 available. Shoppers bought 120, so the rate is 120 divided by 300, which is 40%, and 180 are left.
| Product A | Available | Sold | Sell-through | Left |
|---|---|---|---|---|
| Week 1 | 300 | 120 | 40% | 180 |
| Week 2 | 280 | 130 | 46% | 150 |
| Week 3 | 250 | 135 | 54% | 115 |
| Week 4 | 215 | 150 | 70% | 65 |
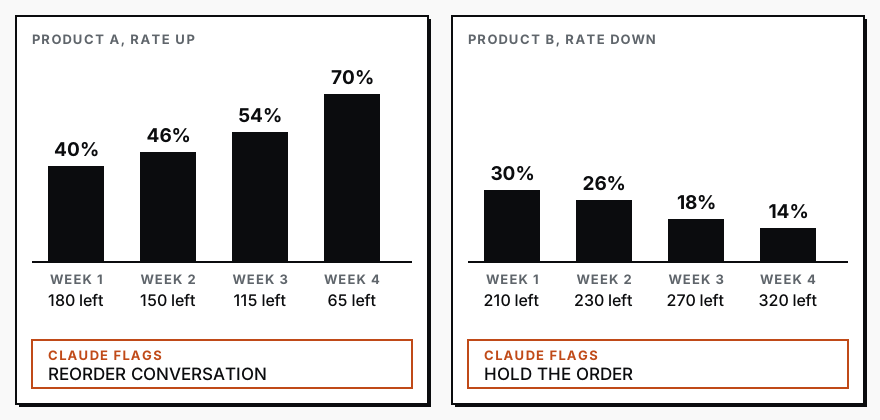
Sales rose a little, from 120 to 150 units. The rate rose much faster, because the stock behind the sales kept shrinking. At the end of week 4 the stores hold 65 units and sold 150 that week. That is less than half a week of shelf. A rising rate with stock heading to zero is the moment for a reorder conversation, and it is already late if your reorders take longer than a week to arrive.
Product B tells the opposite story from the same arithmetic.
| Product B | Available | Sold | Sell-through | Left |
|---|---|---|---|---|
| Week 1 | 300 | 90 | 30% | 210 |
| Week 2 | 310 | 80 | 26% | 230 |
| Week 3 | 330 | 60 | 18% | 270 |
| Week 4 | 370 | 50 | 14% | 320 |
Its sales fell and its stock grew. At week 4's pace, 320 units lasts 6.4 weeks. A reorder now adds to the pile. The conversation to have is about why it slowed down, such as a price, a shelf position or a promotion that ended, and not about quantity.
How sell-through differs from velocity
Velocity is units per store per week. It tells you how fast an item sells where it sits on the shelf, and it is usually the buyer's yardstick. I wrote about counting the right stores for that number. Sell-through tells you how much of what you delivered has gone. A product can meet a buyer's velocity number and still be over-shipped, because velocity says nothing about how much sits behind the sales. Keep both views, and use sell-through for the reorder decision.
Two cautions before you read a trend. A promotion week lifts the rate for that week, so mark promotion weeks first, and work out how many units a promotion has to sell before you judge the weeks around it. And if the units in your two exports disagree with each other, settle that first, which is the problem in which number is right.
What rate should make you worry
I will not give you a percentage that works for every brand, because any number I named would be invented. The threshold that matters is yours: how many weeks it takes a reorder to reach the shelf. Divide the units left by this week's sales to get the weeks of stock remaining. Worry when that is shorter than your reorder time and the rate has risen for several weeks. Worry the other way when the rate has fallen for several weeks and the stock left covers many weeks of sales.
The units left are worked out from your two exports, not counted on a shelf. Transfers between stores, damaged units, returns and a wrong starting count all move the real figure. Use the number to start a conversation, and ask the buyer for their own on-hand count when the decision is large.
Have Claude do the arithmetic every week
In the older days you would put the shipments in one tab and the sales in another, line up the weeks product by product, work out what was left on the shelf each week, and divide. For thirty products that is most of a morning, and you do it again next week.
Today, give Claude (Anthropic's AI assistant) the two exports and the instructions below, and you have your answer in under a minute. The instructions are what is usually called a prompt, which is just the words you type in. Paste this one as it is.
What comes back is one line per product: the rate for each week, the units left, how many weeks they would last, and a flag on the two cases above. It is the picture above, for every product at once.
I am attaching two exports for the same retailer. The first lists what we shipped, with a date and a number of units for each shipment. The second lists units sold to shoppers, by product and by week. Match the products and the weeks. For each product and each week, work out the units available (the units the stores held at the start of the week plus the units shipped that week), the units sold, and the sell-through rate, which is units sold divided by units available. If the second file shows what the stores held at the start of the first week, use it. If not, assume they started with nothing and say so at the top. Then give me one line per product: the sell-through rate for each week, the units left at the end of the latest week, and how many weeks that stock would last at the latest week's pace. Add REORDER CONVERSATION to any product whose rate rose three weeks running and whose stock would last under three weeks. Add HOLD THE ORDER to any product whose rate fell three weeks running and whose stock would last more than six weeks. Also list any week where units sold were more than double the week before, so I can check whether a promotion ran.Whoever pulls your distributor reports each week pastes this into a new chat with the two files attached. Your part is reading the flagged lines. Three weeks is a stand-in, so change it to the number of weeks your reorders take to arrive. Next week, add the new exports to the same chat.
If you would rather have your whole weekly readout built and waiting, that is what the Reporting Sprint at Nordic Navigators does.
Services
Reporting SprintNobody spends their week building the report. You open it and see what is working, what is leaking, and where to push next.
CPG AI Assessment
Fix the CPG workflow that keeps landing back on your desk.
I map the recurring reporting or operating workflow first, then build only when the first useful fix is clear.